

Articles
Use of Trigonometric Function to Model Periodic Phenomena

Introduction
We have already learned that sine and cosine functions are defined for all real numbers. Also, we observe that for each real number x,  -1 ≤ sin(x) ≤ 1 and -1 ≤ cos(x) ≤ 1
Thus, domain of y=sin(x) and y= cos(x) is the set of all real numbers and range is the interval [-1, 1]. Since cosec(x) = 1/sin(x), the domain of y= cosec(x) is the set {x: x Є R and x ≠ nπ, n Є Z} and the range is the set {y: y Є R, y≥1 or y≤-1}. Similarly, the domain of y=sec(x) is the set {x : x Є R and x≠(2n+1)π/2, n Є Z} and range is the set {y: y Є R, y≤-1 or y≥1}. The domain of y= tan(x) is the set {x: x Є R and x≠ (2n+1)π/2, n Є Z} and range is the set of all real numbers. The domain of y=cot(x) is the set {x: x Є R and x≠nπ, n Є Z} and the range is the set of all real numbers.
The values of sine, cosine and tangent can be seen in the table below
| Ф | 0˚ | π/6 | π/4 | π/3 | π/2 | π | 3π/2 | 2π |
| Sin(Ф) | 0 | 1/2 | 1/√2 | √3/2 | 1 | 0 | -1 | 0 |
| Cos(Ф) | 1 | √3/2 | 1/√2 | 1/2 | 0 | -1 | 0 | 1 |
| Tan(Ф) | 0 | 1/√3 | 1 | √3 | ∞ | 0 | ∞ | 0 |
The values of cosec(x), sec(x) and cot(x) are the reciprocal of the values of sin(x), cos(x) and tan(x) respectively.
First we can plot the points taking angles along x-axis and values against y-axis using the above given values. Below given is the sine curve and cosine curve.
The sine values are increasing to 1 and decreasing through the same values to -1, then returning to 0. When we connect all these values using a smooth curve we get a periodic curve of y=sin(x)
Graphs of sine and cosine functions
The sine curve with the equation y=sin(x) is the simplest trigonometric graphs. The curve rises and falls by one unit from its axis of oscillation- in this case after going through 360˚, again we come across the same y values. The same pattern can be seen for cosine graph also.
Each sine and cosine graph has two basic characteristics
1. The distance the curve rises above and falls below, its axis of oscillation is called amplitude and it is given by
amp = max – min
2
2. The length of one cycle is called period of the graph and this can be calculated by measuring the distance between maximum or minimum points or doubling horizontal distance between a minimum and the next maximum point.
Here the amplitude is 1 and period is 360˚ or 2π radians.
Graph of y = Sin (x) 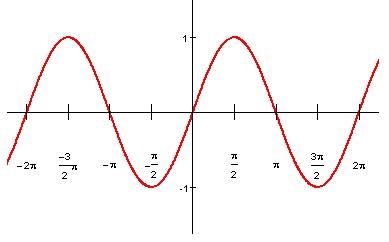
Graph of y = Cos (x) 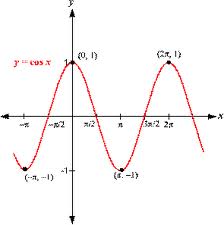
Modeling Periodic Phenomena
We get the trigonometric models of y = a sink (θ + b) + d and y = a cosk (θ + b) + d by first graphing periodic sinusoidal data.
We can model and solve many real-life problems using y = a sink(θ + b)+d or y = acosk(θ + b) + d.
The values of a, k, b and d are found by determining the transformations that must be applied to y= sin(θ) or y= cos(θ), respectively, to obtain the graph of the data.
Example: Determine the function that is simplest model of the following data
| Independent variable | -90˚ | -45˚ | 0˚ | 45˚ | 90˚ | 125˚ | 180˚ |
| Dependent Variable | 8 | 6 | 4 | 6 | 8 | 6 | 4 |
Solution: The curve will be either sine or cosine function
Case I: Sine Model
For sine model, y = asink(θ + b) + d
The maximum value is 8 and minimum value is 4
The equation of axis is y = 8 + 4 = 6
2
Then d, the vertical translation is 6
The amplitude a = 8 – 4 = 2
2
The period is 180˚. There are two complete cycles for each complete cycles of y = sinθ. The horizontal compression is a factor of ½ so k=2, b= -45˚
Now substitute these values to the equation y = asink(θ+b)+d to get
y = 2 sin2(θ-45˚)+6
Case II: Cosine Model
Here also k=2, d=6, a=-2 and b=0 so that the equation y=acosk(θ+b)+d becomes
y = -2 Cos 2(θ+0)+6
y = -2cos2θ+6
Now try it yourself! Should you still need any help, click here to schedule live online session with e Tutor!
About eAge Tutoring:
eAgeTutor.com is the premium online tutoring provider. Using materials developed by highly qualified educators and leading content developers, a team of top-notch software experts, and a group of passionate educators, eAgeTutor works to ensure the success and satisfaction of all of its students.
Contact us today to learn more about our tutoring programs and discuss how we can help make the dreams of the student in your life come true!
Reference Links:


Archives
- ► 2020 (2)
- ► 2019 (11)
- ► December (3)
- ► March (6)
- • Communicate your passion at work for career success
- • How to lodge a telephonic complaint against a faulty bill
- • To speak good English, surround yourself by people who speak English fluently
- • How to score “high-band” in IELTS speaking test
- • How to improve your spoken English fluency
- • How to communicate with energy for more effective meetings
- ► February (1)
- ► January (1)
- ► 2018 (44)
- ► November (1)
- ► October (5)
- • Understand the difference between improve and improvise
- • How to convince your manager to give you added work responsibilities
- • How to give a thank you speech at your promotion party
- • How to ask for a leave extension from your manager
- • Why speaking good English at the workplace still makes a difference to your career
- ► September (1)
- ► August (6)
- • How to improve English Listening and Comprehension Skills
- • Why good English is important for a career in SEO
- • Restaurant Etiquette – How to create afavourable impression when eating out
- • How to compliment your office colleagues in English
- • How to request for compassionate leave in your office
- • Improve your Office Communication with these English Sports Idioms
- ► July (3)
- ► June (3)
- ► May (4)
- ► April (1)
- ► March (2)
- ► February (18)
- • Telephonic Interview Tips and Mistakes to Avoid
- • Common English Usage Differences: Bring versus Take
- • Listen to good English speeches to improve your own English
- • Understanding Future Tense to avoid common mistakes
- • How to speak politely while raising a complaint to customer service department?
- • How to ask the right questions: Developing a vital life skill
- • How to politely refuse additional work responsibilities
- • Top grammar mistakes to avoid in spoken English
- • Top mistakes during telephonic interviews and how to avoid them
- • How to politely interrupt a conversation
- • Popular Brand Names You’ve Been Mispronouncing All This Time
- • When to use "a Lot", "Very" and "So"
- • Common English Grammar Mistakes: Usage of Among vs Between
- • How to express condolence in English
- • How to use right filler words or 'gap words' in English conversation
- • How to use English words– Remember, Remind and Memorise
- • English words that can replace “Very”
- • Understanding usage of confusing English words "Ago" & "Before"
- ► 2017 (72)
- ► December (2)
- ► October (13)
- • Avoid common English mistakes: How and when to use "one of", "some of" and "few of"
- • Difference between ‘how about’ and ‘what about’ and how to use it
- • 10 English Body Idioms
- • Common mistakes between I, me, mine and myself
- • How to ask someone to wait (in English)
- • Difference between Sometimes, Sometime and Some Time
- • How to ask for clarification in English
- • How to say someone is right in English
- • Phrases to discuss about sleep
- • Interesting ways to say "Nice to meet you"
- • How to start Social Conversation in English at a party
- • Use of correct English in Social Media
- • How to build your English vocabulary – and Why?
- ► August (6)
- ► June (3)
- ► May (8)
- • Tips for planning JAM session
- • Commonly mispronounced words in English
- • Do you know these English Travel Idioms? – Part one
- • Do you know these English Travel Idioms? – Part two
- • Phrasal Verbs using “Do”
- • 8 interesting bossy English words you must know
- • Idioms used to shut someone up
- • 7 Homophones you should know
- ► April (10)
- • Phrasal verbs about socializing you must know
- • Vocabulary for car owners
- • How to improve English with funny idioms? – Part one
- • How to improve English with funny idioms?
- • How to express confusion in English?
- • Vocabulary related to describing food
- • Vocabulary related to describing food – Part one
- • 4 conversation starters/ ice breaking statements
- • Common mistakes in English speaking
- • Teen slang words one must know
- ► March (10)
- • Learn the correct usage of commonly misused words – Part one
- • Positive phrases for encouraging someone
- • Positive phrases for encouraging someone – part one
- • Learn quick ways to express your emotions through interjections
- • Learn idioms that are used to describe people
- • Vocabulary for talking about relationships
- • How to compliment men in English?
- • Learn the correct usage of commonly misused words
- • Phrases to be used to say someone is right
- • Idioms related to age
- ► February (20)
- • How to warn people?
- • Holiday idioms you must know
- • Holiday idioms you must know – Part one
- • 20 Holiday greetings one must know
- • Idioms based on Hair
- • Points to remember while avoiding nosy people
- • How to describe your day with phrasal verbs?
- • Learn replacements for everyday Adjectives
- • Idioms related to sea
- • Idioms related to sea – Part one
- • 8 Beach vocabulary one must know
- • Are you pronouncing these food terms right?
- • 8 Beach Vocabulary Words one must know - Part one
- • Points to remember while avoiding nosy people
- • Learn about gender nouns with examples
- • How to convey condolences in English?
- • 10 uses of 'Have'
- • Difference between – sorry, excuse me & pardon
- • 5 everyday idioms one must know
- • 5 everyday idioms one must know – Part one
- ► 2016 (150)
- ► December (15)
- • 10 everyday vocabulary for drinks and beverages
- • Phrasal verbs based on 'To Think'
- • Difference between: In Time and On Time
- • Vocabulary to be used while describing fitness
- • Idioms related to Christmas
- • Homophones you need to know
- • Idioms based on Time
- • Trending English words you must know
- • Fashion vocabulary that you should know
- • Types of letters in English
- • Learn words that have opposite meanings
- • Learn words that have opposite meanings – Part one
- • Difference between: Life, Live and Lives
- • Business etiquette rules one must know
- • Phrasal verbs with 'Put'
- ► October (31)
- • Vocabulary to be used when describing gadgets
- • Phrasal verbs you need to know
- • What are contractions in English?
- • Phrasal Verbs you should use in a communication
- • How to Tell a Story?
- • Learn these spooky Halloween idioms- Part one
- • Learn these spooky Halloween idioms- Part two
- • Vocabulary to be used for describing Traffic and Commute
- • Difference between ‘Some’ and ‘Any’
- • Vocabulary to be used for hand movements
- • How to interrupt politely in English?
- • How to ask for a permission or approval?
- • Vocabulary to be used while discussing about Apartments
- • How to share good and bad news in English?
- • Vocabulary to be used while discussing about Celebrities
- • How to describe your favourite music?
- • How to talk about your dream job?
- • Vocabs related to travel destination
- • 3 Essential Things to Remember while Tweeting
- • Learn phrases to describe the character of a person
- • Words to describe office politics
- • Words to describe office politics (Part 1)
- • Vocabulary to be used for describing weather
- • How to describe household chores in English?
- • What are fillers in English?
- • Difference between 'under', below', 'beneath' and 'underneath'
- • How to improve your pronunciation with the help of tongue twisters?
- • How to politely say 'no'?
- • Tech and Photography slang words that you need to know
- • How to complain politely?
- • Crazy Idioms you need to know
- ► September (6)
- ► August (13)
- • 6 Simple ways of learning English for House Wives
- • 8 Powerful words for a Manager
- • Vocabulary to be used when describing your native place
- • 9 Brexit words you need to know now
- • Funny food idioms you need to know
- • Funny food idioms you need to know (Part: 1)
- • How to encourage people around you?
- • Idioms that suggest you are busy
- • Vocabulary to be used while discussing beauty problems
- • How to form Adverb from Adjective
- • How to justify yourself in good English?
- • Idioms related to business negotiations
- • How to manage an appointment?
- ► July (17)
- • Vocabulary to be used when describing your favorite movie
- • Vocabulary to be used when describing your organization
- • Things to keep in mind when preparing for an important meeting or presentation
- • Unless and until – Learn the difference
- • Use of There, Their and They're
- • Vocabulary related to money
- • Vocabulary to be used when describing your favourite newspaper
- • Must know everyday English phrases – Part 1
- • 20 must know everyday English phrases
- • Importance of nonverbal communication at workplace
- • Phrases to be used when apologizing in business
- • Finance vocabulary you need to know
- • Vocabulary for communicating cost cutting measures
- • Criterion vs. Criteria – Learn the correct usage
- • Grammatically correct way to write dates
- • Are you using preposition 'by' and 'to' interchangeably?
- • How to Learn English for Tourism and Hospitality?
- ► June (15)
- • How to Sign Off an Email?
- • 5 Common Email Mistakes
- • 10 common words with different origins
- • Between vs. Among - Know the difference
- • How to Introduce Yourself Professionally in 1 Minute?
- • How To Speak About Your Strengths In 1 Minute?
- • Points To Remember When Handling Crisis at Work
- • Vocabulary for Snacks
- • Principal vs Principle - Know the Difference
- • How to Speak About your Weakness in 1 Minute?
- • Six Phrases That You are Saying Incorrectly
- • English Idioms Used in the Corporate World
- • How to Use 'Wh' Question Words?
- • Learn About Anagrams with Easy Examples
- • Then vs. than - Know the correct usage
- ► May (16)
- • English Phrases to Make Your Travel Smooth
- • How to Overcome Hesitation While Speaking English?
- • Why immigrants Must Learn English?
- • English Phrases to Express Shock and Sympathy
- • Especially vs. Specially - Know the Difference
- • Compliment vs. Complement -Know the Difference
- • How to Stay Motivated When Learning English?
- • Words to Describe Facial Expressions
- • Different types of sentences used in English language
- • 5 reasons why you should learn English speaking
- • Why parents should encourage their children to speak English?
- • Can I or May I - know the difference in usage
- • How to give & receive compliments in English?
- • How to avoid cross-cultural miscommunication?
- • Simple tips to ace a job interview
- • Your vocab guide to eating and shopping in an airplane
- ► April (15)
- • Are you familiar with these royal English Phrases?
- • Difference between the terms - newborn, infants, toddlers
- • The correct usage of hyphens
- • How to talk about your job role and company?
- • Why a housewife should learn English?
- • How to make your toddler learn English?
- • Famous Shakespeare quotes every English learner must know
- • Ways to say goodbye in English
- • How to write good subject lines for emails?
- • 10 must know phrases to sound fluent in ENGLISH
- • Idioms related to heart
- • Learn these Music Idioms
- • Phrases for Spring and Summer
- • Are you familiar with the Facebook vocabulary?
- • Grooming tips for a job interview
- ► March (6)
- ► February (15)
- • How to Write a Good Business Email? - Part 1
- • Phrasal Verbs with Take
- • Rules for Business Phone Calls
- • 7 must know English expressions about food
- • How to Learn English through the News?
- • Learning English with the help of a radio
- • How to Make a Fluent First Impression in English?
- • How to describe people in English?
- • 5 Tips to improve your English spelling
- • 5 Tips to Self-Study English Effectively
- • How to speak to a customer care representative regarding a dispute in electricity bill?
- • How to Use the Word “Go”? – Part 1
- • 7 English Shopping Vocabulary Words
- • How to answer confidently in an exit interview?
- • Tips to improve communication skills with pop culture knowledge
- ► January (1)
- ► December (15)
- ► 2015 (151)
- ► December (18)
- • How to Write a Good Business Email?
- • Commonly Used British and American Slang Words
- • Do you know the difference between see, look and watch?
- • Must know English Greetings
- • Must know English Travel Phrases
- • Slang English greetings and expressions
- • 7 must know animal idioms
- • When to use also and too
- • Present continuous/present perfect - Can you identify the difference?
- • Learning Simple Present Tense with examples
- • What are adverbs of frequency?
- • Are you pronouncing these words right???
- • How can humor help you learn English?
- • Top 5 Tips to Learn To Speak English Fluently
- • How to express your dislike for something?
- • Idioms with fruits and veggies
- • 10 must know winter idioms
- • How to start a conversation?
- ► November (8)
- • Which vs who vs That - Learn the correct usage
- • Phrasal Verbs with Get
- • Smart Answers To Tricky Job Interview Questions
- • Do you know the rules for silent letters?
- • English vocabulary for sports
- • 10 Business English Phrasal Verbs
- • When to use where, were and wear
- • Little, a little, few and a few - Know the usage
- ► October (8)
- ► September (12)
- • 7 English Idioms with the word SHOW
- • 10 Must know airport vocabulary words
- • Must know cooking verbs
- • How to give the perfect presentation in English?
- • How to learn English by dedicating just 15 mins daily?
- • Five Must know Health Idioms
- • 7 Popular color idioms and their meanings
- • Sports idioms and its use in business and daily life
- • 9 Things you can do now to improve English
- • A guide to subjunctives
- • Avoid subject verb disagreements
- • Common mistakes in tenses: When to use had, have and has?
- ► August (20)
- • Difference between ourselves, yourselves and themselves
- • Ensuring correct usage of Comparatives and Superlatives
- • How to learn English through Twitter?
- • The lazy man's guide to learning English
- • Smart tips to succeed in an interview
- • Introduce yourself with confidence
- • Figures of speech- Oxymoron
- • Learn the correct usage of adjectives and adverbs
- • Correct usage of "will" and "going to"?
- • Foreign phrases commonly used in spoken English
- • Modal verbs and its types
- • How to use the definite article “the” appropriately?
- • Negative adjectives to describe people
- • What are Quantifiers?
- • Subject, Predicate and Object
- • What are linking verbs?
- • What is a Root word?
- • What are stative verbs?
- • What are relative clauses?
- • When to use - used to and would
- ► July (2)
- ► June (15)
- • Difference between ‘made of’ and ‘made from’
- • Difference between simile and metaphor
- • Over vs Under
- • Tips to use contractions
- • Auxiliary verbs vs Lexical verb
- • Common mistakes while using prepositions
- • Prefix and suffix
- • Parentheses and Dashes
- • A guide to determiners
- • What is a conjunction?
- • Use of must, should and ought to
- • Types of clauses you must know
- • Simple, compound and complex sentences
- • video Article
- • Rules for correct use of apostrophe
- ► May (32)
- • How to cheer your favorite sports team?
- • Capitalization rules for nouns
- • Definite and indefinite pronoun
- • Fun with Homonyms
- • Five Grammar Rules you should be breaking
- • Singular and plural nouns including irregular plural nouns
- • What are conditionals?
- • Adverbs of manner
- • Three Main Functions of “Have”
- • Basic coordinating conjunctions
- • Basic Subordinate Conjunctions
- • How to use reported speech in English?
- • When To Use Although & Though.
- • Use of either/or and neither/nor
- • Figures of speech - Personification
- • What are phrasal verbs?
- • Eight Most useful English proverbs you should learn right now
- • How to Learn English by Speaking at Home?
- • How to order food in English like a local?
- • Do you know the I/E Rule?
- • Do you know the difference between shall and will?
- • A guide to Gerunds
- • A guide to interjections
- • Idioms about Health
- • Use of too and enough
- • What are collocations?
- • How to use Appositives?
- • Five Shopping Idioms for Black Friday
- • How to make friends?
- • 5 Weird English Words You Won’t Believe Exist!
- • Four Daily English Phrases to be used in different way
- • When to spell out numbers?
- ► April (8)
- • 5 Fun and Effective Ways to Learn English Vocabulary
- • 5 Things you must not say at a business meeting
- • How to talk on phone with a foreign client?
- • How to use STILL, YET, and ALREADY?
- • Simple guide to capitalization
- • The difference between listen and hear
- • Slang Words You’ve Got to Know
- • Simple guide to punctuation
- ► March (22)
- • How to start a conversation in English?
- • Misspelled words that can affect/effect your communication?
- • How to develop confidence in fluency?
- • How to learn English on the Go!
- • How to overcome common obstacles while learning English
- • How to talk about a viral video you saw recently?
- • How to talk to your boss for the first time?
- • How to follow table manners?
- • 5 Reasons why reading habits are important
- • How to edit your own writing?
- • Did you know there are two ways to pronounce "the"?
- • 5 Benefits of Reading English Books
- • How to talk about a trending personality online?
- • Learn about prepositions of time
- • 7 Ways to improve your communication
- • Difference between a CV, Resume and Bio-data
- • 7 Tips for better writing
- • Basics of English Grammar
- • Learn English using social networking sites
- • Do you know the difference between "Say", "Tell" and "Speak”?
- • The number 1 secret to learning English
- • How to introduce yourself impressively in an interview?
- ► February (2)
- ► January (4)
- ► December (18)
- ► 2014 (197)
- ► December (5)
- ► October (15)
- • A guide to food idioms and their usage
- • Top 20 Grammar mistakes we all make – Part I
- • Decoding body language for effective communication
- • How to use measuring words?
- • How to take help from the security guard at the ATM
- • How to complain about your colleagues?
- • How to describe your eye problems to an ophthalmologist?
- • Steps to take if your phone is stolen
- • The perfect way to make a clarification
- • The right way of discussing sensitive topics
- • Tips to give a supporting opinion
- • How to delegate a new task to a new employee?
- • How to disagree politely?
- • How to make an indirect request?
- • How to motivate your team for a marathon?
- ► September (6)
- ► August (10)
- • Common expressions used for comparing things
- • Expressions for making suggestions
- • Common English mistakes that we need to be careful
- • How to reply a callback to a query of a customer telling him that his services are resumed?
- • How to report a burglary to the police?
- • How to report a lost book to the library?
- • Learn the art of speaking hypothetically
- • How to cancel a credit card subscription
- • A simple guide to online communication
- • How to lodge a complaint?
- ► July (5)
- ► April (17)
- • Me, Myself, And I – Do you know the right usage?
- • Learning plurals with examples
- • How to effectively communicate as a retail sales rep?
- • How to explain your product to a customer?
- • How to impress guests with freebies?
- • How to introduce your company?
- • How to create a promotion letter in a professional format setting?
- • How to describe/market your business to a prospective client?
- • How to write a relieving letter?
- • Basic vocabulary in graphs and charts
- • How to report a burglary to the police in a foreign country?
- • How to report your stolen debit/ credit card to the police & bank?
- • How to stop your service provider subscription, in a foreign country?
- • How to follow up after interview candidates?
- • How to explain IT product advantages in simple words to a customer?
- • How to solve an employee query in HR department?
- • How to write payment reminders?
- ► March (58)
- • How to handle an emergency situation at a foreign location?
- • How to handle a noisy neighbor?
- • How to handle a traffic cop in a pullover at a foreign location?
- • How to ask for a lift in case of car breakdown?
- • How to undergo medical treatment in a foreign location?
- • How to deal with “irate guest” at a reception?
- • How to inquire about local entertainment centers in a foreign location?
- • I.e. v/s E.g.: Do you know the difference?
- • How to lodge a complaint for deficiency in service at a complaint center?
- • Do you know the difference between formal, semi-formal, and informal English?
- • How to request for a meeting?
- • How to raise a query in a classroom?
- • The art of excusing yourself for a call
- • How to respond to billing queries for a guest?
- • How to increase your English speed for entrance exams?
- • How to politely refuse a service free of charge to a guest?
- • Pronunciation guide for a handful of difficult words
- • It's or its – Do you get confused between the two?
- • How to book/cancel an appointment and inquire about Spa services?
- • Tips to discuss fears and phobias in English
- • How to negotiate for an appraisal?
- • How to take a customer survey (Restaurant)
- • Online communication/chatting etiquettes
- • The art of giving instructions
- • How to talk about music in English?
- • How to complain about your colleague?
- • How to give a vote of thanks?
- • Avoid these nervous mannerisms in an interview
- • Learn the art of asking for inputs
- • Because, as, since, for – how, where & when to use?
- • Tips to express your appreciation
- • How to read a newspaper article to improve your English?
- • How to request for permission from examiner?
- • How to ask for a favor?
- • How to buy a phone card for international calling in a foreign country?
- • How to respond to a “THANK YOU”?
- • An easy guide to learn figures of speech – Part I
- • Decoding body language for effective communication
- • At, by – Difference & usage with examples
- • How to ask help from the security guard at the ATM?
- • Study of etymology: How it can help to improve your English?
- • Fun English tongue twisters!
- • How to clarify billing questions with a utility company?
- • How to file a police complaint for a loss of car, purse, and passport?
- • How to speak to Immigration officers?
- • How to travel in a public transport in a foreign country?
- • How to talk to your neighbors explaining them about India and Indian culture?
- • How to write a letter to your landlord about various issues at the house?
- • How to invite people for a Christmas party?
- • How to send New Year wishes to your clients?
- • Tips for an extempore speech in English
- • How to ask a girl for a coffee date?
- • How to improve your English writing skills through blogging?
- • Enhance your spoken English with proverbs
- • How to conduct an ideal interview conversation?
- • How to give a farewell speech?
- • The work of ‘tenses’ in English grammar
- • How to describe a painting?
- ► February (54)
- • How to break a bad news?
- • How to invite people for a function you’re hosting?
- • How to express likes and dislikes?
- • How to apologize for your rude behavior?
- • Vocabulary for motivational speeches
- • How to apologize in a business environment?
- • How to create an activity plan for your class?
- • How to talk/write with finesse in a big company?
- • How to motivate students to perform better?
- • What exactly does your job consist of?
- • How to deal with an emergency situation in School?
- • 5 Things to avoid doing at an interview
- • The Perfect body language at an interview
- • How to raise a concern to parents regarding deteriorating performance of a child?
- • Commonly used English Vocabulary for nurses
- • List of the most common phrases that you can use in a business letter
- • Active and Passive Voice- Learn the right usage
- • How to describe an interesting neighbor?
- • How to describe an interview to your friend?
- • Common sentences used to make a sale
- • How to respond while arriving late in a meeting?
- • Learning English tenses with examples
- • List of longest words in English
- • How to ask a girl for a dance?
- • How to close a conversation?
- • Grammar for improving your spoken English skills
- • The use of noun and verb phrases
- • How to host a social event at school?
- • The right use of this, that, these, those
- • Understand the concept of definite and indefinite articles
- • How to describe the store layout of your outlet?
- • English for Web Designers
- • How to improve English with the help of comic strips and books?
- • How to apologize when you forget important dates?
- • How to praise a good performing child in front of the class?
- • How would you ask for "volunteers" to organize a college farewell?
- • How to introduce your colleagues and boss to a newly acquired client?
- • Everything about conjunctions
- • Conversation tips for support executives
- • How to state opinions on various subjects?
- • How to describe your traveling experience by flight?
- • Importance of English for IT professionals
- • How to describe your traveling experience?
- • How to talk about your future plans, aims and aspirations?
- • How to ask for contributions from parents for a social event in school?
- • Parts of Speech: Learn the basics
- • Comparative and Superlative Adjectives- Do you know enough?
- • Prepositions and its use in the English language
- • Introduction to and appropriate use of adverbs
- • Tips to become an advanced English speaker
- • Importance of effective communication skills in accounting
- • Countable v/s uncountable nouns
- • How to communicate cost cutting measures to employees?
- • Question tags: All you need to know about it!
- ► January (27)
- • How to request for an elaboration?
- • Learn English slang to improve your spoken fluency
- • The art of using ‘verbs’ in the right manner
- • Introduction and appropriate use of adjectives
- • How to explain a billing query?
- • How to describe your gym/ training classes?
- • How to describe the project you are handling or have handled?
- • What is direct and indirect speech?
- • Punctuate the sentence
- • How to explain product features to a customer?
- • How to attend a customer call as support executive?
- • How to build a rapport with your patient?
- • How to explain product features on the phone?
- • How to deal with an adolescent in school?
- • How to remind parents to inculcate good habits in their children?
- • 5 Tips to practice vocabulary
- • How to be a good wedding host?
- • How to diplomatically report a problematic child behaviour to Principal and parents ?
- • How to explain to a customer some confusion in the bill?
- • How to upsell a product over the phone?
- • How to convince a customer to try out a product?
- • How to ask about patient history?
- • Common Phrases for business letters
- • 5 Supplier negotiation tips
- • How to describe your role model?
- • How to ask for help from other school teachers?
- • How to politely refuse an advance or loan request from an employee?
- ► 2013 (198)
- ► December (4)
- ► November (23)
- • Use of could, should, would?
- • When to use the articles - a, an, the?
- • Common ‘Singular-Plural’ Mistakes – Part I
- • How to ask for directions and find your way in a foreign country?
- • Talking about life events - Summer vacations
- • How to express your happiness while receiving a certificate?
- • How to describe school you attended in the past?
- • Top 10 tips for an effective meeting
- • 10 common mistakes in English
- • How to explain charges to a guest?
- • How to handle a guest with young children and elderly people?
- • How to talk about a teacher you like very much?
- • Tips to make a first good impression on foreign coworkers
- • How to fill up an immigration form?
- • How to place an order in a fast food restaurant?
- • How to navigate and buy essentials in a supermarket in a foreign country?
- • How to politely accept or decline an appointment request?
- • How to improve your grammar and comprehension for Entrance exams?
- • How to improve your vocabulary for entrance exams?
- • How to take orders in a restaurant?
- • How to converse at the front desk?
- • How to explain the project plan to a group of senior management members?
- • How to grab an internship opportunity?
- ► October (33)
- • Etiquettes for an international call center
- • How to deal with a nasty employee?
- • How to conduct group discussions for interviews?
- • How to conduct an exit interview?
- • How to communicate with your subordinates to get the maximum output?
- • How to build relationship with a customer for enhancing sales?
- • How to alert your boss about a worrying financial trend like increase in expense?
- • Etiquettes for effective telephone calls
- • How to show around during sightseeing?
- • How to upsell in a restaurant and a bar?
- • How to write a warning letter?
- • Salary negotiation essentials for HR personnel
- • Tips for communication for hotel Industry
- • How to resolve conflict with employees?
- • How to take care of specially abled guests?
- • How to deal with layoffs in your company?
- • How to write an effective financial performance summary?
- • How to welcome and see off your guests?
- • How to talk about local customs and folklore?
- • How to raise a query to the technical team in fluent English?
- • How to make a browsing customer comfortable and convert?
- • How to conduct an HR interview effectively?
- • How to write a termination letter?
- • How to politely respond to unreasonable demands of the customer?
- • How to explain your job profile, technologies you have worked and skill set?
- • How to communicate effectively with foreign or remote clients?
- • Dos and Don’ts of effective sales communication
- • How to speak professionally? – Conversation examples
- • How to create a job description?
- • How to explain issues in a project functionalities?
- • How to request for change in delivery schedule?
- • How to write a loan application for your own business?
- • How to explain local rules and precautions?
- ► September (18)
- • How to respond to salary queries of employees?
- • How to take reservations by phone?
- • How to effectively make a presentation?
- • How to explain a new technology to a non-techie person?
- • How to explain your strengths, weakness, attitude, and skill sets?
- • How to deal with complaints in the Hotel Industry?
- • How to write a reminder for a delayed payment to a customer?
- • How to write an offer letter?
- • How to take care of inbound calls?
- • How to convert a window-shopper to a real customer?
- • How to motivate a disinterested customer to buy?
- • How to upsell and cross sell?
- • How to make requests for special meals on a flight?
- • The art of handling unhappy customers on a call
- • 5 Negotiation tips and tricks
- • 5 Email marketing etiquette
- • 10 Mistakes to avoid as a retail sales representative
- • How to make an effective sales call?
- ► August (23)
- • How to ask for a leave from your child’s teacher?
- • How to describe your medical symptoms to the doctor?
- • 5 useful tips to prepare for a call center job
- • How to ask for directions to a coffee shop?
- • How to ask an air hostess about cabin luggage compartment?
- • How to start a cold call?
- • How to make a sales pitch?
- • How to negotiate a higher starting salary?
- • How to deposit or withdraw money in a bank?
- • How to give medicine instructions to a patient?
- • Why is correct ‘Speed’ important in Spoken English?
- • How to give details of a disease to a patient?
- • How to describe your vehicle?
- • How to open a bank account?
- • How to improve your English for a call center job?
- • 5 Benefits of learning English for a Tour Guide
- • How to ask your child’s teacher for notes?
- • How did you decide on a subject for higher studies?
- • How to start a conversation on phone?
- • How to ask your boss for a promotion in fluent English?
- • How to buy a ticket for a movie?
- • How to buy a shirt with the help of a salesperson?
- • How to buy a dress with the help of a salesperson?
- ► July (30)
- • How to Write a Formal Letter Regarding Leave?
- • How to Describe your Home?
- • How to Ask a Waiter for his Recommendations?
- • Why is Daily Practice Important to Learn a New Language?
- • How to Describe Your Family?
- • How to Describe your Phone and its Features?
- • How to Get the Speed of the Words Right while Speaking?
- • How to Talk About a Particular Problem you are Facing?
- • How to Talk About a Book you’ve Read Recently?
- • How to Introduce your Boss to your Team?
- • How to Complain to the School’s Principal About your Child’s Class?
- • How did you Choose the College you Studied In?
- • How to Talk at a Parent Teacher Meeting?
- • How to Describe an Attire?
- • How to Talk to Other Patients While Waiting at The Doctor’s Clinic?
- • How to Give Directions to Reach your Doctor’s Clinic?
- • How to Talk to a Teacher About the Issue of Bullying?
- • How to Ask your Boss for Help in your Work?
- • The Critical Role of Vocabulary to Learn Fluent English
- • How to Greet your Boss/ People in Office?
- • How to Describe an Experience?
- • How to Talk About Your Opinions?
- • How to Talk about Your College Life?
- • Conversation with a Fellow English Learner
- • How to Talk About Your Child’s School?
- • How to Describe a Television Show you Saw?
- • How to Ask for the Bill in a Restaurant?
- • How to Talk to Your Boss to Change Your Department?
- • How to Seek Appointment with your Doctor’s Receptionist?
- • How to Describe a Meal You Relished to Your Friend?
- ► June (13)
- • How to Give Directions to Your Friend to Reach a Restaurant?
- • How to Ask for Directions?
- • Why Online Tutoring is Easy and Beneficial?
- • Why English is Considered an International Language?
- • How to Write a Formal Email Regarding a Leave/ Off?
- • How to Tell Your Boss that You are Quitting?
- • How to Talk About Food you Like/ Dislike?
- • How to Talk of an Error in Your Bill to the Manager?
- • Why do We Need to Learn English?
- • How to Describe a Restaurant to Your Friend?
- • How to Stress on Words While Speaking English?
- • How to Describe Your Country?
- • How to Describe Your City?
- ► May (17)
- • Test your English Skills
- • Learning English through Music - Go the Lyrical Way!
- • How to Make English Learning a Fun Process?
- • How to Maintain Your Social Image?
- • How to Best Describe a Place?
- • How to Learn English Real Fast?
- • A Fun Way to Learn English
- • How Should I Improve My Vocabulary for IELTS?
- • Practice English Speaking While Waiting for an Interview
- • How to use Punctuation Correctly? Part - II
- • Tips for Improving Pronunciation II
- • The Sounds of Syllables
- • How to Improve Communication Skills?
- • How to Use Punctuation Correctly? Part - I
- • The Fun World of Idioms - III
- • Gear up! It’s Test Time
- • Conversation at the Airport Check-in
- ► April (35)
- • IELTS Preparation – Things to Know
- • How to Structure English Sentences?
- • A Guide on How to Use a Dictionary Effectively
- • The Fun World of Idioms - I
- • How to Carry a Conversation at a Party?
- • How to Overcome the Anxiety of Making Mistakes when Speaking English?
- • Dos and Don'ts of Public Speaking
- • Conversations while Ordering Food
- • Use the Power of Phrases to Improve Your Spoken English Fluency
- • Understanding the Tenses in English – II
- • Start small - The Key to Fluent English Speaking
- • Understanding the Tenses in English
- • How to Face an Interview with Confidence?
- • English Exercises for Beginners
- • How to Improve Your English Writing Skills – II
- • How to Improve Your English Writing Skills
- • Memory Techniques for Learning English - II
- • How to Avoid Common Grammar Mistakes - I?
- • Complete Guide to Comprehensive Reading-II
- • Want to Improve Your Listening Skills? Know the Eight Principles - Part II
- • How to Greet? Learn the Basics
- • A Guide to Comprehensive Reading
- • Want to Improve Your Listening Skills? Know the Eight Principles - Part I
- • Business Communication - Your Key to Success
- • First Timer’s Guide to Improve Spoken English
- • The Pillars of English Speaking
- • Who or Whom: Learn the Right Usage with Examples
- • Memory Techniques for Learning English
- • Tips for Making Small Talk and Breaking the Ice
- • A Beginner’s Guide to Learning English
- • Golden Rules for Improving Spoken English
- • The Tricky World of Homophones
- • English Grammar Made Easy
- • Homophones Decoded
- • How to Avoid Common Grammatical Mistakes
- ► January (2)
- ► 2012 (49)
- ► December (6)
- ► October (6)
- ► September (12)
- • How to write compelling emails in English?
- • How to Talk to Strangers?
- • How to Improve Pronunciation?
- • How to communicate as a telephone operator?
- • How to Communicate as a Receptionist?
- • How to Answer Phone Calls Smartly in English?
- • How to write an application for a loan?
- • How to Write a Cover Letter for a Job?
- • How to make a presentation in front of audience?
- • How to Express Effectively?
- • How to Communicate well in Hospitality Industry?
- • What are Some Etiquettes Used While Eating?
- ► August (25)
- • What are some phrases for conversation?
- • How to write an application for a leave?
- • How to Raise Concern in Parent Teacher Meeting As a Parent?
- • How to book an airline ticket with travel agent?
- • What are some important email etiquette
- • How to improve English Pronunciation and English Speaking?
- • How To Invite Somebody For a Birthday Party ?
- • How to Write a Resume for a Job?
- • How to learn English through listening?
- • How to improve your Spoken English Skills?
- • How to learn English Online?
- • What are words with similar meaning /opposite meaning to another word known as?
- • What are some common mistakes in preposition?
- • How to chat online with friends?
- • What are vowels and Consonants ?
- • What are some important table manners?
- • Do you know what is the study of speech sound known as?
- • How to impress the interviewer and answer effectively in an interview?
- • Learn Root Words
- • Do you know about the important parts of your body?
- • Do you know what are words with similar pronunciation but with different meaning/spelling known as?
- • What are some Do’s and Don’ts at the Interview?
- • How do you define a word that cannot be figured out by looking up in the dictionary?
- • How to participate in a Group Discussion
- • What are words that confuse you known as?
- ► 2011 (406)
- ► December (4)
- ► November (46)
- • TYPES OF MATRICES
- • SYMMETRIC AND SKEW SYMMETRIC MATRICES
- • Solution of system of linear equations using matrix method
- • PROPERTIES OF DETERMINANTS
- • MULTIPLICATION OF MATRICES
- • MORE ABOUT MATRICES
- • INTRODUCTION TO MATRICES
- • INVERTIBLE MATRICES
- • EQUALITY OF TWO MATRICES
- • DETERMINANTS
- • ADJOINT AND INVERSE OF A MATRIX
- • ADDITION AND SUBTRACTION OF MATRICES
- • Shortest Distance between two lines
- • Reducing Cartesian Form of a line to Vector Form and vice-versa
- • Modulus and the Conjugate of a Complex Number
- • Argand Plane and Polar Representation of a Complex Number
- • ALGEBRA OF COMPLEX NUMBERS
- • VOLUME OF A SOLID WITH KNOWN CROSS SECTION
- • TAYLOR SERIES
- • TANGENTS AND NORMALS
- • RIEMANN SUM AND TRAPEZOIDAL RULE
- • RATIO TEST
- • RATE OF CHANGE OF QUANTITIES
- • NUMERICAL SOLUTION OF DIFFERENTIAL EQUATIONS USING EULER’S METHOD
- • Mean Value Theorem
- • MAXIMA AND MINIMA (2nd DERIVATIVE TEST)
- • MAXIMA AND MINIMA (1ST DERIVATIVE TEST)
- • LOCAL LINEAR APPROXIMATION
- • LIMITS
- • L’HOSPITAL’S RULE
- • INTRODUCTION TO INTEGRATION
- • INTERMEDIATE VALUE THEOREM
- • INSTANTANEOUS RATE OF CHANGE AS A LIMIT OF AVERAGE RATE OF CHANGE
- • INDEFINITE INTEGRALS – II
- • INDEFINITE INTEGRALS – I
- • INCREASING AND DECREASING FUNCTIONS
- • GRAPHICAL AND ANALYTICAL REPRESENTATION OF DERIVATIVE
- • FUNDAMENTAL THEOREM OF CALCULUS
- • DISTANCE TRAVELLED BY A PARTICLE ALONG A LINE
- • DIFFERENTIATION - II
- • DIFFERENTIATION
- • DIFFERENTIATION - I
- • Differentials, Errors and Approximations
- • DIFFERENTIAL EQUATIONS
- • DERIVATIVES OF POLAR AND VECTOR FUNCTION
- • DEFINITE INTEGRALS
- ► October (14)
- • Continuity
- • COMPARISON TEST
- • AVERAGE VALUE OF A FUNCTION
- • ASYMPTOTIC AND UNBOUNDED BEHAVIOUR
- • AREA OF BOUNDED REGIONS
- • ALTERNATE SERIES TEST
- • LAWS OF SINE, COSINE AND TANGENT
- • Operations on Sets
- • Complement of a Set
- • Ionic Equilibrium in Solutions
- • Homogeneous and Heterogeneous Equilibria
- • Factors Affecting Equilibria
- • Equilibria in Physical Processes
- • Equilibrium in Chemical Processes – Dynamic Equilibrium
- ► September (28)
- • Buffer Solutions
- • Use of Trigonometric Function to Model Periodic Phenomena
- • UNIT CIRCLE
- • TRIGONOMETRIC RATIOS
- • TRIGONOMETRIC RATIOS OF SOME SPECIFIC ANGLES
- • TRIGONOMETRIC RATIOS OF COMPLEMENTARY ANGLES
- • TRIGONOMETRIC IDENTITIES
- • TRIGONOMETRIC FUNCTIONS OF SUM AND DIFFERENCE OF TWO ANGLES
- • TRIGONOMETRIC FUNCTIONS OF MULTIPLE AND SUBMULTIPLE ANGLES
- • SIGNS AND GRAPHS OF TRIGONOMETRIC FUNCTIONS
- • INVERSE TRIGONOMETRIC FUNCTIONS
- • APPLICATIONS OF TRIGONOMETRY
- • Angle between two planes
- • Vector and Cartesian Equations of a Line
- • Various forms of a Plane
- • Direction Cosines and Direction Ratios of a Line
- • METHODS OF FINDING SQUARE ROOT
- • SQUARE ROOT
- • CUBE ROOT (PRIME FACTORIZATION)
- • USE OF EXPONENTS
- • Laws of Exponents
- • PARABOLA
- • CONIC SECTIONS
- • HYPERBOLA
- • ELLIPSE
- • SYMMETRY
- • ROTATIONAL SYMMETRY
- • TYPES OF ANGLES
- ► August (97)
- • Potentiometer
- • Thermocouple
- • Parallel Plate Capacitor
- • Sources of Current
- • Resistivity and Conductivity
- • Resistance
- • Kirchhoff’s law
- • Emfs and Internal resistance
- • Safety measures in handling electrical circuits
- • Electricity
- • Magnetic field due to a solenoid
- • Magnetic field
- • Electromagnetic Induction
- • Electric motor
- • Electric Bell
- • Electric Potential
- • Earthing an electric appliance
- • Electric Dipole
- • Rules to determine the direction of a magnetic field
- • Electric Current
- • Equipartition of Energy
- • Degree of freedom
- • Kinetic Theory of Gases
- • Combination of Capacitor
- • Thermodynamics
- • Thermal conductivity
- • Stefan’s law
- • Volumetric Expansion
- • Thermal Expansion
- • Newton’s law of cooling
- • AC and DC current
- • Heat and Temperature
- • Linear Expansion
- • Gas Equation
- • Heat transfer
- • Charle’s law and Boyle’s law
- • Heat engines
- • Specific Heat
- • Enthalpy and Entropy
- • Thomson effect
- • Isothermal Process
- • Carnot engines
- • Isochoric processes
- • Thermoelectricity
- • Isobaric Process
- • Adiabatic Processes
- • Seebeck effect
- • Wind Energy
- • Solar Energy
- • Nuclear Energy
- • Geothermal Energy
- • Fossil Fuels
- • Peltier Effect
- • Voltage and Current
- • Young’s Double Slit Experiment
- • Dielectrics
- • Types of Diffraction
- • Total Internal Reflection
- • Faraday’s law of Electrolysis
- • Spherical Mirror
- • Electrolysis
- • Snell’s Law
- • Scattering
- • Refractive Index
- • Refraction
- • Reflection
- • Real and Virtual images
- • Polarization
- • Mirages
- • Interference of Light
- • Focal Length of Mirrors
- • Dispersion
- • Diffraction of Light
- • Diffraction Grating
- • Parallelism
- • MODIFIER
- • Degrees of Comparison
- • Clause
- • Adverbs
- • Nouns
- • Verbs
- • Subject Verb Agreement
- • Punctuation
- • Phrases
- • Pronouns
- • Run-on and Fragments
- • Gerunds
- • Comparison of Adjective
- • Infinitive
- • Pronoun Antecedent Agreement
- • Voice
- • Interjection
- • Conjunctions
- • Parts of Speech
- • Sentences
- • Tenses
- • Comma Splice
- ► July (106)
- • Non-Random Mating
- • Genetic Drift
- • Modes of Speciation
- • Fossils
- • Bottlenecks and Founder Effects
- • Causes of Mutations and Gene Flow
- • Artificial Selection
- • Recombination
- • Hardy-Weinberg Principle
- • Sex and Genetic Shuffling
- • Adaptation & Fitness
- • Sexual Selection
- • Patterns of Evolution
- • Reproduction Isolation
- • Origin of Life
- • Speciation
- • Big Bang Theory
- • Dinosaurs
- • Natural Selection
- • Virus
- • Protist
- • Monera
- • Introduction of Microorganism
- • Fungi
- • Intracellular Components
- • Cell Membranes
- • Cell Difference
- • The Citric Acid Cycle
- • Photosynthesis and Cellular Respiration
- • Oxidative Phosphorylation and Electron Transport
- • Introduction to Cell Respiration
- • Glycolysis
- • What is Mitosis?
- • What is Meiosis?
- • Fermentation
- • Cell Reproduction
- • Mutualism
- • Solving Fractions
- • Microevolution
- • Fractions - An Introduction
- • Macroevolution
- • Evolution and Darwin
- • Evolution and Lamarck
- • Solving Decimals
- • Evolution and Heredity
- • What is Evolution?
- • Plasmids
- • Gene Cloning Application in Medicine
- • Introduction to Decimals
- • Human Genome Project
- • Polymerase Chain Reaction
- • Nucleosomes
- • Introduction to Lines and Angles
- • Structure and Synthesis of RNA
- • Overview of RNA
- • Solution of a Linear Equation
- • RNA
- • Introduction to Linear Equations
- • Introduction to Linear Equations
- • DNA and Technology
- • Graphical Method of Solution of a Pair of Linear Equations
- • DNA Biological Functions
- • History of DNA Research
- • Graph of a Linear Equation in Two variables
- • DNA Interactions with Proteins
- • Algebraic Methods of Solving a Pair of Linear Equations
- • Central Dogma of Biology
- • Algebraic Methods of Solving a Pair of Linear Equations
- • DNA Modifying Enzymes
- • DNA Genetic Recombination
- • General characteristics of DNA
- • Properties of DNA
- • What is DNA?
- • Algebraic Methods of Solving a Pair of Linear Equations
- • Solving Integers
- • Properties of Integers
- • DNA Translation
- • Genetic Code
- • Comparing and Ordering of Integers
- • Introduction to Exponents
- • Stages in Nitrogen Cycle
- • Introduction to cubes and cube roots
- • Slope (Gradient) of a line
- • Relation to the Environment
- • Section formulae
- • Point of intersection and concurrency of lines
- • Biological -Interactions
- • Distance form of a line
- • Distance between two points
- • Important Microbes in Ecosystem
- • Different forms of the equation of a straight line
- • Co-ordinate axes and co-ordinate planes
- • Area of a Triangle
- • Human Vs Natural Food Chains
- • Replication of DNA
- • Post transcriptional RNA Processing
- • DNA Transcription
- • Structure of Nucleic Acids - RNA
- • Structure of Nucleic Acids – DNA
- • Adaptations of the Organism
- • Factors Affecting Population Size
- • Evolution of Predation
- • Eutrophication
- • Energy Flows and Material Cycling
- • Energy Flow through the Ecosystem
- • Ecosystem Services and Biodiversity Crisis
- ► June (48)
- • Ecosystem Productivity
- • A Seral Community
- • Ecological Role
- • Ecological Pyramids
- • The Ecological Niche
- • Ecological Impact of Farming
- • Environmental impact of Pesticides
- • Environmental Impact of Fertilizers
- • Decomposers
- • Food Webs
- • Biosphere
- • Biological Magnification
- • What Is an Atom?
- • Laws of Chemical Combination
- • Solid Wastes
- • Global Warming
- • Environmental Issues
- • Water Pollution
- • Air Pollution
- • Deforestation
- • Food Chains and Food Webs
- • Phosphorous Cycle
- • Oxygen Cycle
- • The Nitrogen Cycle
- • The Water Cycle
- • The Carbon Cycle
- • Biogeochemistry
- • Biogeochemical Cycles
- • Biodiversity
- • Behavioral Ecology
- • ECOLOGY – An Introduction
- • Trigonometric Equations
- • Introduction To Algebra
- • Integers – An Introduction
- • Gaseous State And Gas Laws
- • Intermolecular Forces Vs Thermal Energy
- • How do you write Chemical Formulas?
- • Electroplating
- • Electrochemical cell
- • Electric circuit
- • Electric Charge
- • Coulomb’s law
- • Conductor and Insulator
- • Degree And Radian Measure
- • Algebraic Expressions
- • Adjectives
- • What Is a Molecule?
- • What Is Thermal Energy?
- ► May (63)
- • Study Finds That Online Education Beats the Classroom
- • Contraception Methods
- • Function and Mechanism in implantation
- • Implantation
- • Stages of Lactation
- • Lactation
- • Fertilization and Cleavage
- • Causes of Mutation
- • Kinds of Gene Mutation
- • What is a Gene Mutation and how do mutations occur?
- • Genes and Diseases
- • Human Genetic Variation
- • Chromosomal Aberrations
- • Location of a Gene
- • What is a Chromosome?
- • Gene and Gene Organisation
- • Functional structure of a Gene
- • Complications in Child birth
- • Stages in Child birth
- • Parturition
- • Risk factors and Complications in Pregnancy
- • Embryonic and Fetal Development
- • Diagnosis and Physiology of Pregnancy
- • Pregnancy
- • Mendalian Inheritance
- • Mendel's Laws
- • Examination, Treatment and Prevention of Menopause
- • Menopause
- • Characteristics of Menstrual Cycle
- • Mendel’s trait and Probability of Inheritance
- • Phases of Menstrual Cycle
- • Menstrual Cycle
- • Hormonal controls and the functioning of the female reproductive system
- • The Human Ovaries
- • Position and Function of Cervix
- • Anatomy and Histology of Cervix
- • Function of Fallopian Tube
- • Hygiene and Signs of Vaginal disease
- • Anatomy and Functions of Vagina
- • Inheritance patterns through Generations
- • Sex Determination System
- • What are the layers found in Uterus?
- • Genetic Disorder
- • Anatomy and Function of Uterus
- • Autosomal Recessive Genetic Disorder
- • Autosomal dominant and X linked Genetic Disorder
- • Human Female Reproductive System
- • Human Male External Genital Organs
- • What are Genes?
- • Human Male Internal Genital Organs
- • Phases And Significance Of Meiosis
- • Meiosis and process involved in it
- • Mitosis and its Phases
- • Check Point In Cell Cycle
- • Cell Cycle And Its Stages
- • Reproductive System
- • Cell Division
- • Transport Across The Membrane
- • Anatomy Of The Cell
- • Cell and Cell Theory
- • Home
- • Cell Organelles and Their Functions
- • Cell Organelles and Their Functions
- ► 2006 (10)
- ► October (10)
- • Example Pages and Menu Links
- • I installed with my own language, but the Back-end is still in English
- • Does the PDF icon render pictures and special characters?
- • Is it useful to install the sample data?
- • What is the purpose of the collation selection in the installation screen?
- • Is it possible to change A Menu Item's Type?
- • Support and Documentation
- • My MySQL database does not support UTF-8. Do I have a problem?
- • What happened to the locale setting?
- • Only one edit window! How do I create "Read more..."?
- ► October (10)
- ► 0000 (4)
Blog Subscription
Most Read Blog Posts
- How to Write a Formal Email Regarding a Leave/ Off?
- How to Describe Your Family?
- How to Describe your Home?
- How to Greet your Boss/ People in Office?
- How to Seek Appointment with your Doctor’s Receptionist?
- How to Describe a Restaurant to Your Friend?
- How to Describe your Phone and its Features?
- How to express likes and dislikes?
- How to Describe Your City?
- How to describe your favourite movie?
Recent Blog posts
- Improve your English vocabulary by learning root words
- Essential skills for the workplace in the 2020s
- How to score band 7 and above in IELTS?
- Voracious reading: The real secret to building a strong English Vocabulary
- 5 English phrases to avoid in conversation and display greater social awareness
- Communicate your passion at work for career success
- How to improve your spoken English fluency
- How to lodge a telephonic complaint against a faulty bill
- How to communicate with energy for more effective meetings
- To speak good English, surround yourself by people who speak English fluently